NAME
Noelle Matthews
ROLE
Commercial Property Manager
noellematthews@gmail.com
PHONE
209 988 1054

Fast Food Sales Visualization: Recreate & Create
A midterm milestone that marked my early growth in R and ggplot after entering the program with no prior coding experience.
This project was part of my first midterm in Data Visualization. We were given data from QSR Magazine’s Top 50 Fast Food Chains of 2023 and asked to recreate a chart from a Chartr article using R. We also had to build an alternative version of the graphic to highlight different insights.
I used skills from both my Data Visualization and Data Science with R courses to complete the assignment. I applied ggplot2 to build bubble charts comparing total U.S. store count with average revenue per unit, using bubble size to represent total systemwide sales. I worked with aesthetic mappings, manual scale adjustments, text annotations, and customized theming. My alternative version shifted focus from overall revenue to franchise density, highlighting brands like Subway over McDonald’s.
This was a major moment for me because I had never coded before starting the program. Being able to replicate and then improve on a professional chart just halfway through the semester felt like a clear reflection of how much I had already learned.
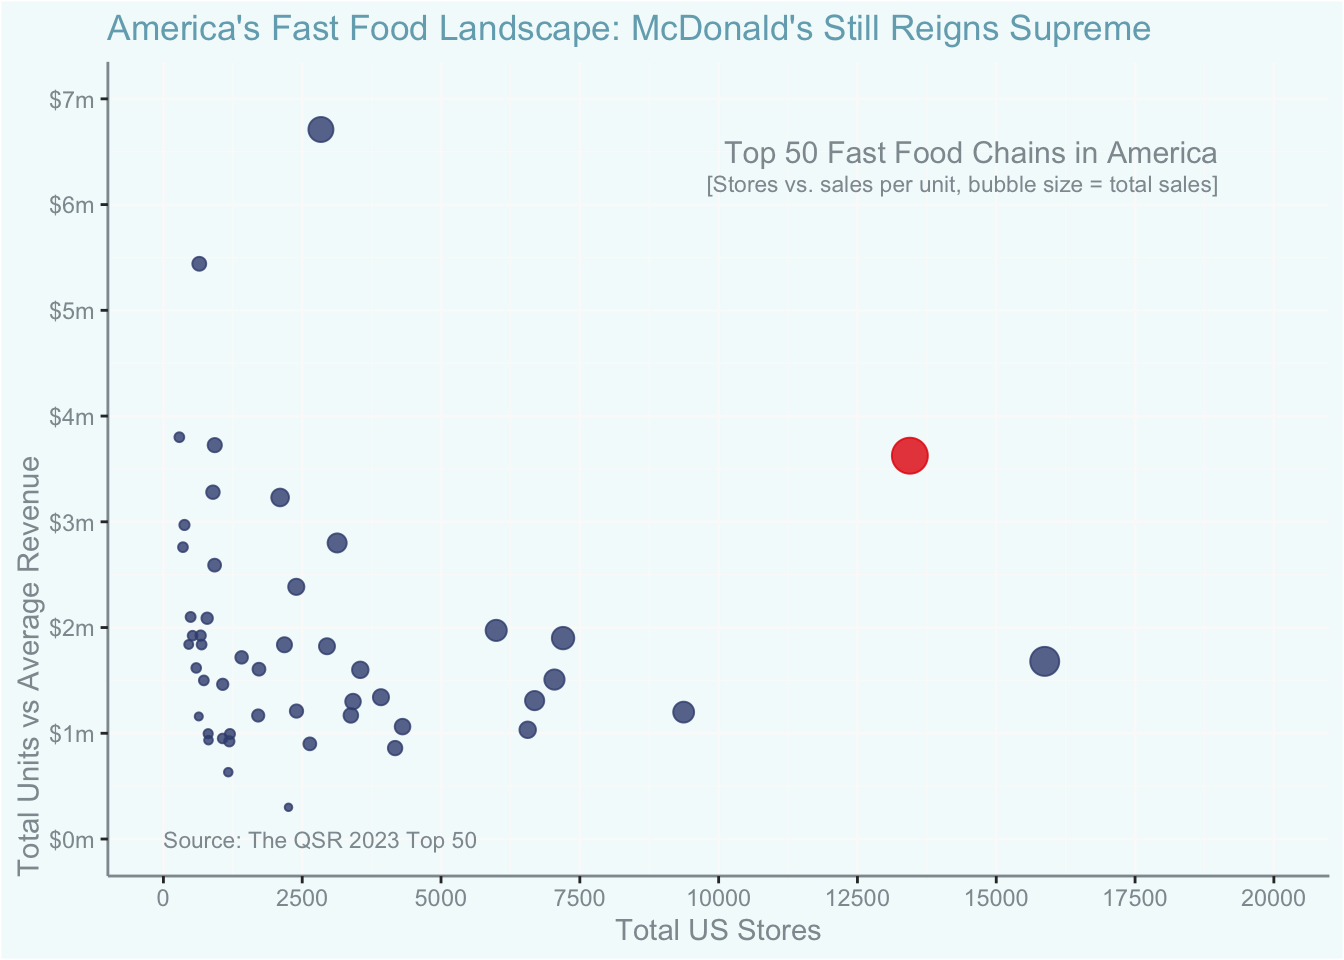
I had never coded before starting this program in Fall 2023, so recreating this by midterm felt huge. I didn’t get the yellow outline around McDonald’s, but I was so proud of how close I came- and how far I’d already come.
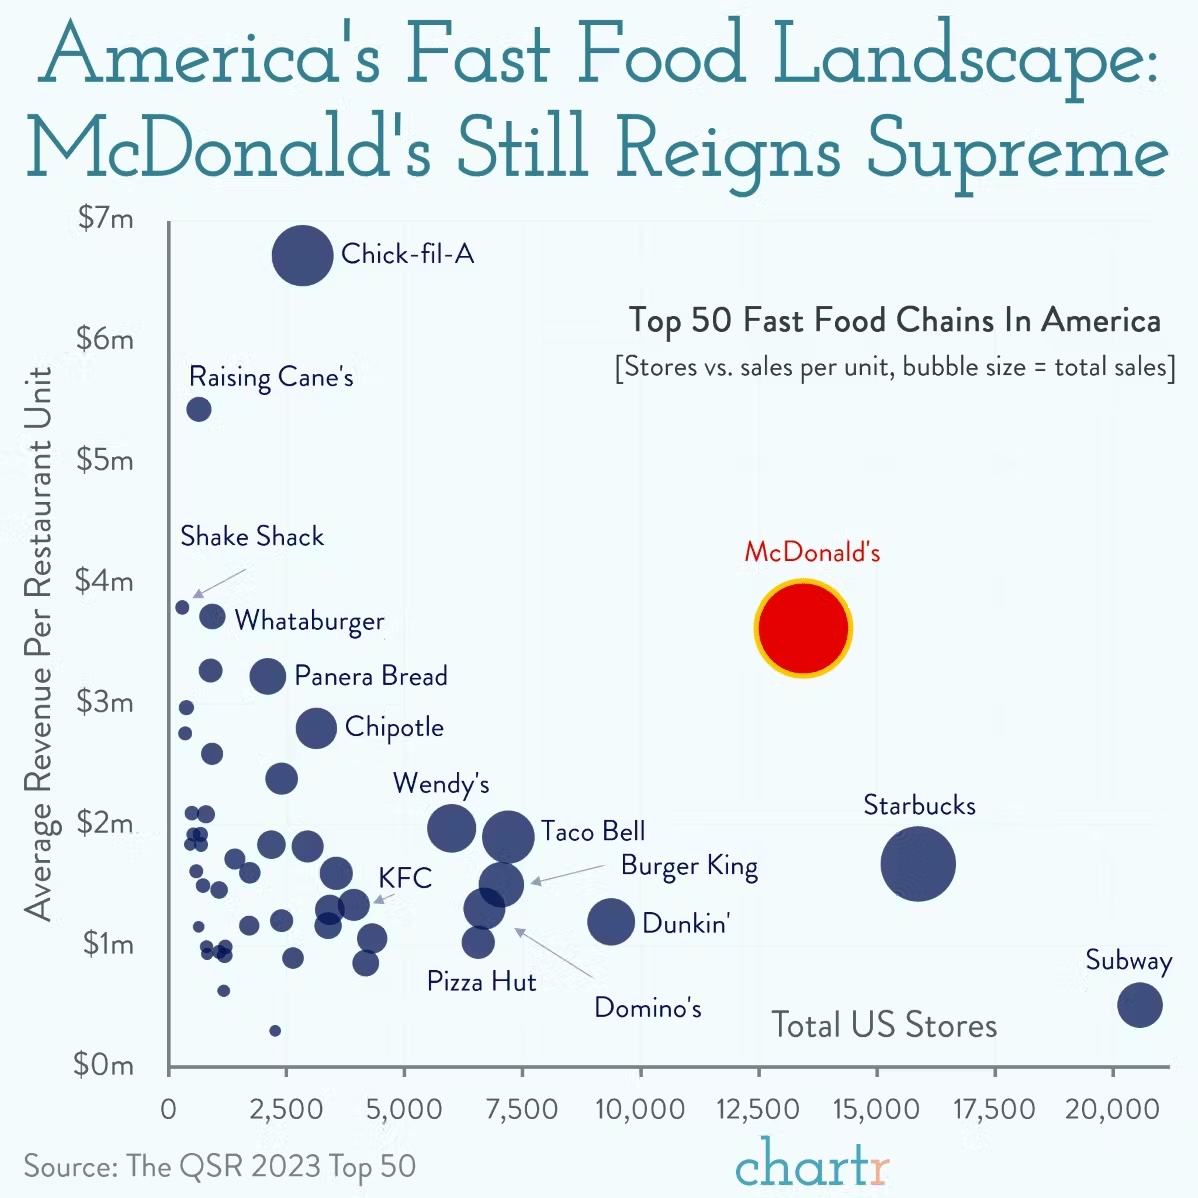
The original chart from Chartr (August 2023), visualizing total U.S. sales and average unit volume for major fast food chains.